ELK+filebeat 监控 nginx 日志
零、 环境介绍
OS: CentOS 7.9ELk: v8.17.2Filebeat: v8.17.2Nginx v1.20.1
一、 部署 ELK
添加源
cat >> /etc/yum.repos.d/elk.repo << EOF
[ELK]
name=Elastic repository for 8.x packages
baseurl=https://artifacts.elastic.co/packages/8.x/yum
gpgcheck=1
gpgkey=https://artifacts.elastic.co/GPG-KEY-elasticsearch
enabled=1
autorefresh=1
type=rpm-md
EOF
安装
yum install -y elasticsearch logstash kibana filebeat
二、 配置 ELK
2.1 ElasticSearch 配置
修改监听
/etc/elasticsearch/elasticsearch.ymlnetwork: "0.0.0.0"配置 elastic 密码
/usr/share/elasticsearch/bin/elasticsearch-reset-password -u elastic访问测试
[root@localhost ~]# curl -k -u elastic:f0FdL8-gvj=tfnb-Hugg https://localhost:9200
{
  "name" : "localhost.localdomain",
  "cluster_name" : "elasticsearch",
  "cluster_uuid" : "YXsi6PaGTv-LbzCA3zHtIw",
  "version" : {
    "number" : "8.17.2",
    "build_flavor" : "default",
    "build_type" : "rpm",
    "build_hash" : "747663ddda3421467150de0e4301e8d4bc636b0c",
    "build_date" : "2025-02-05T22:10:57.067596412Z",
    "build_snapshot" : false,
    "lucene_version" : "9.12.0",
    "minimum_wire_compatibility_version" : "7.17.0",
    "minimum_index_compatibility_version" : "7.0.0"
  },
  "tagline" : "You Know, for Search"
}
配置自启
systemctl enable elasticsearch --now
2.2 配置 Kibana
修改监听
/etc/kibana/kibana.ymlserver.host: "0.0.0.0"重启 kibana
systemctl restart kibana获取 token
/usr/share/elasticsearch/bin/elasticsearch-create-enrollment-token -s kibana获取 verification code
/usr/share/kibana/bin/kibana-verification-code访问
http://your_kibana:5601输入token和code完成配置配置自启
systemctl enable kibana
2.3 Logstash 配置
创建配置文件
cp /etc/logstash/logstash-sample.conf /etc/logstash/conf.d/logstash.conf修改配置文件如下
input {
  beats {
    port => 5044
  }
}

filter {
  json {
    source => "message"
  }
}

output {
  elasticsearch {
    hosts => ["https://192.168.100.107:9200"]
    index => "nginx-log-%{+YYYY.MM.dd}"
    user => "elastic"
    password => "f0FdL8-gvj=tfnb-Hugg"
    ssl_enabled => true
    ssl_certificate_authorities => "/etc/elasticsearch/certs/http_ca.crt" # 这里注意文件和目录的权限需要修改
  }
}
2.4 Filebeat 配置
编辑配置文件
/etc/filebeat/filebeat.yml注释:
output.elasticsearch
取消注释:output.logstash
根据实际情况配置 logstash 的ip和端口开启 nginx 日志监控
filebeat modules enable nginx编辑配置文件
/etc/filebeat/modules.d/nginx.yml- module: nginx
# Access logs
access:
enabled: true
var.paths: ["/var/log/nginx/access*"]重启 filebeat
systemctl restart filebeat
2.5 Nginx 日志格式配置
- nginx 配置文件
log_format  main          '{"@timestamp":"$time_iso8601",'
                          '"host":"$hostname",'
                          '"client_ip":"$remote_addr",'
                          '"status":"$status",'
                          '"request":"$request",'
                          '"body_bytes_sent":"$body_bytes_sent",'
                          '"http_referer":"$http_referer",'
                          '"http_user_agent":"$http_user_agent"}';

access_log  /var/log/nginx/access.log  main;
三、 验证配置
打开
Kibana访问Management->Index Management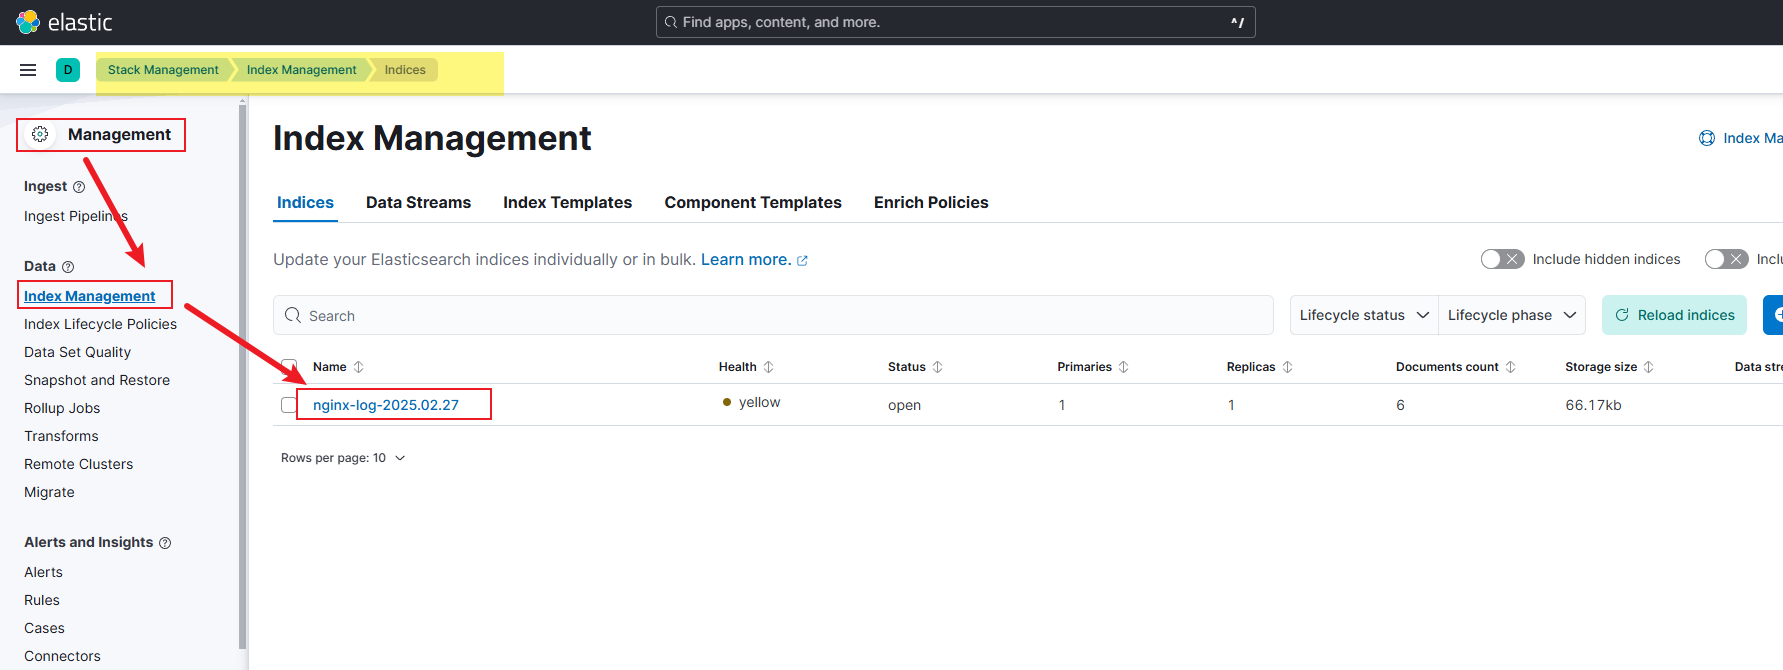
创建
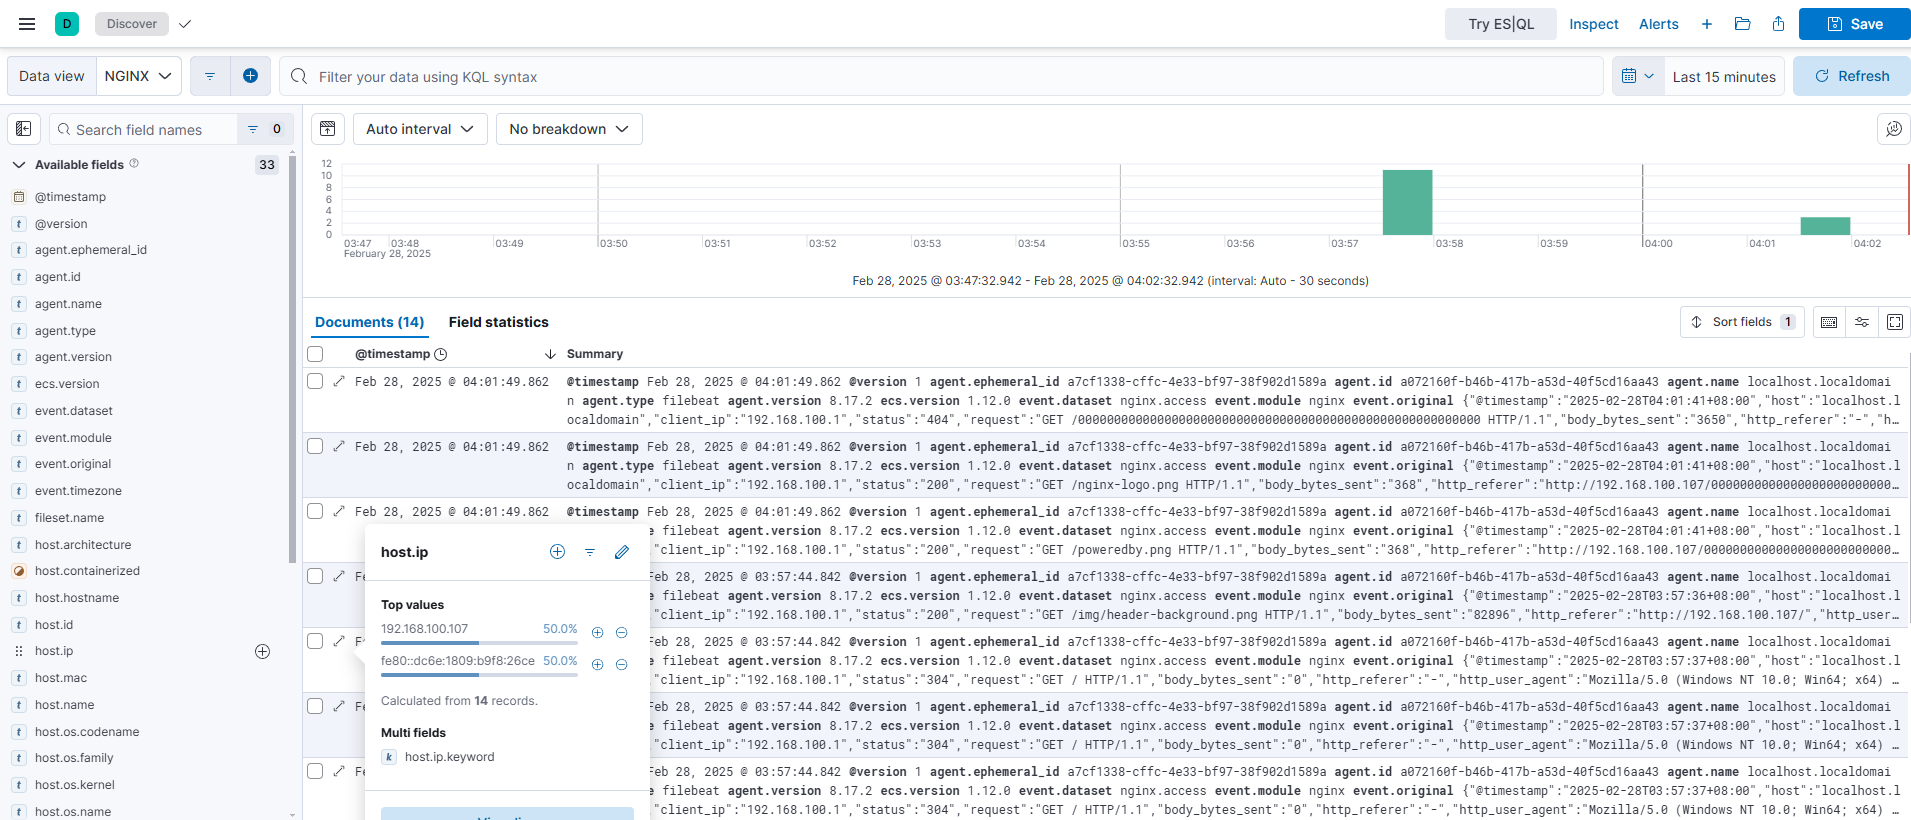
data view